For the past week, Fourth Graders have been learning the essentials of graphing. Reading and creating graphs, understanding the relationship between scale and interval, identifying cumulative frequency, and exploring the ways that data can be displayed are the concepts we have focused on thus far. While our emphasis has been on bar graphs, we’ll extend our exploration of graphs to line graphs, line plots, stem-and-leaf plots, as well as double-bar graphs next week.
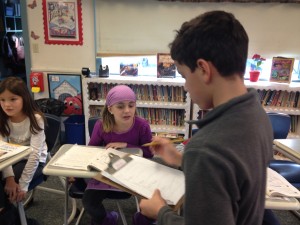
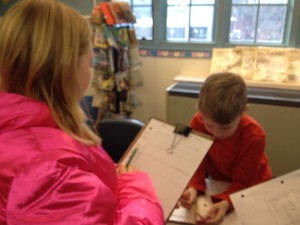
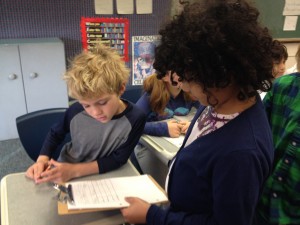
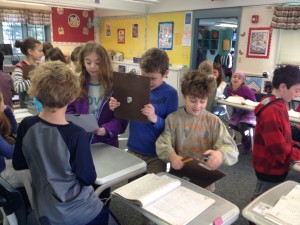
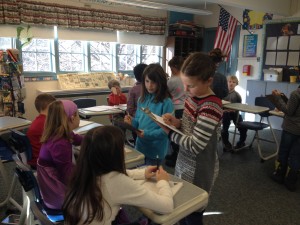
The photos below show the Fourth Graders interviewing the Third Grade through surveys they created. Soon, they’ll be using the data gathered to design their own graphs, along with a set of math problems for the Third Graders to solve. We’ll return to the Third Grade to share the results of the surveys, and to do some teaching of our own with the group.


